Extract-Transform-Load (ETL) with Python
Read, Clean, Create Schema and Load bunch of csv files to MySQL with Python
please make sure to save the notebook on the same directory where you have saved the data.
import pandas as pd
import matplotlib.pyplot as plt
import numpy as np
import seaborn as sns
import os
import datetime
from functools import reduce
import warnings
warnings.filterwarnings('ignore')
Extract the repositories from git
Run following kernel to get file import hassel free working
from pathlib import Path
mypath = Path().absolute()
mypath = str(mypath) + '/Data'

from os import listdir
from os.path import isfile, join
onlyfiles = [f for f in listdir(mypath) if isfile(join(mypath, f))]
onlyfiles
[‘DGS1.xls’, ‘DGS10.xls’, ‘DGS2.xls’, ‘DGS3.xls’, ‘DGS30.xls’, ‘DGS3MO.xls’, ‘DGS5.xls’]
First few lines contains the description about the data, which we don’t need for our analysis.
file_1 = pd.read_excel(str(mypath)+'/DGS10.xls')
file_1.head(15)
| FRED Graph Observations | Unnamed: 1 | |
|---|---|---|
| 0 | Federal Reserve Economic Data | NaN |
| 1 | Link: https://fred.stlouisfed.org | NaN |
| 2 | Help: https://fred.stlouisfed.org/help-faq | NaN |
| 3 | Economic Research Division | NaN |
| 4 | Federal Reserve Bank of St. Louis | NaN |
| 5 | NaN | NaN |
| 6 | DGS10 | 10-Year Treasury Constant Maturity Rate, Perce... |
| 7 | NaN | NaN |
| 8 | Frequency: Daily | NaN |
| 9 | observation_date | DGS10 |
| 10 | 1962-01-02 00:00:00 | 4.06 |
| 11 | 1962-01-03 00:00:00 | 4.03 |
| 12 | 1962-01-04 00:00:00 | 3.99 |
| 13 | 1962-01-05 00:00:00 | 4.02 |
| 14 | 1962-01-08 00:00:00 | 4.03 |
Using a For loop to find all the excel files
Each loop does following:
files_xls = [i for i in onlyfiles if i[-3:]== 'xls']                 # import only xls

all_file={}

for j in files_xls:

    file = pd.read_excel('Data/'+ str(j)).dropna()                   # import excel file, removed rows with Nan

    file.reset_index(inplace= True, drop =True)                      # reset index

    for k in file.index:                                             # To rename the columns, for loop will search for datetime
        if type(file.loc[k][0]) == datetime.datetime:                # untill finds a datetime and rename the column
            break
    file.columns = file.iloc[k-1]

    for k,i in  enumerate(file[str(file.columns[0])]):               # Data cleaning for bad datetime
        if type(i) != datetime.datetime:
            file.drop(k, inplace= True)

    file.drop(file[file[file.columns[-1]]==0].index, inplace= True)  # Drop all rows with interest rate 0, mainly weekends

    file.reset_index(drop= True, inplace = True)                     # Reset Index

    file['observation_date'] = pd.to_datetime(file['observation_date'])

    all_file[str(j)] = file                                          # Save clean DataFrame in the empty dictionary
Using Pandas.merge(), inner join on date field Using reduce fuction, inner join all seven Dataframes in single line of code,
result = reduce(lambda left, right: pd.merge(left, right , sort=False,
                                              on = ['observation_date'],
                                              how = 'outer'), all_file.values())
result.tail(15)
| 1 | observation_date | DGS1 | DGS10 | DGS2 | DGS3 | DGS30 | DGS3MO | DGS5 |
|---|---|---|---|---|---|---|---|---|
| 14146 | 2018-08-22 | 2.43 | 2.82 | 2.6 | 2.65 | 2.99 | 2.09 | 2.7 |
| 14147 | 2018-08-23 | 2.43 | 2.82 | 2.61 | 2.66 | 2.97 | 2.08 | 2.72 |
| 14148 | 2018-08-24 | 2.44 | 2.82 | 2.63 | 2.68 | 2.97 | 2.09 | 2.72 |
| 14149 | 2018-08-27 | 2.47 | 2.85 | 2.67 | 2.7 | 3 | 2.12 | 2.74 |
| 14150 | 2018-08-28 | 2.47 | 2.88 | 2.67 | 2.73 | 3.03 | 2.13 | 2.77 |
| 14151 | 2018-08-29 | 2.48 | 2.89 | 2.67 | 2.75 | 3.02 | 2.13 | 2.78 |
| 14152 | 2018-08-30 | 2.47 | 2.86 | 2.64 | 2.72 | 3 | 2.11 | 2.75 |
| 14153 | 2018-08-31 | 2.46 | 2.86 | 2.62 | 2.7 | 3.02 | 2.11 | 2.74 |
| 14154 | 2018-09-04 | 2.49 | 2.9 | 2.66 | 2.73 | 3.07 | 2.13 | 2.78 |
| 14155 | 2018-09-05 | 2.49 | 2.9 | 2.66 | 2.72 | 3.08 | 2.14 | 2.77 |
| 14156 | 2018-09-06 | 2.5 | 2.88 | 2.64 | 2.71 | 3.06 | 2.13 | 2.76 |
| 14157 | 2018-09-07 | 2.53 | 2.94 | 2.71 | 2.78 | 3.11 | 2.14 | 2.82 |
| 14158 | 2018-09-10 | 2.54 | 2.94 | 2.73 | 2.78 | 3.09 | 2.14 | 2.83 |
| 14159 | 2018-09-11 | 2.55 | 2.98 | 2.76 | 2.83 | 3.13 | 2.15 | 2.87 |
| 14160 | 2018-09-12 | 2.56 | 2.97 | 2.74 | 2.82 | 3.11 | 2.16 | 2.87 |
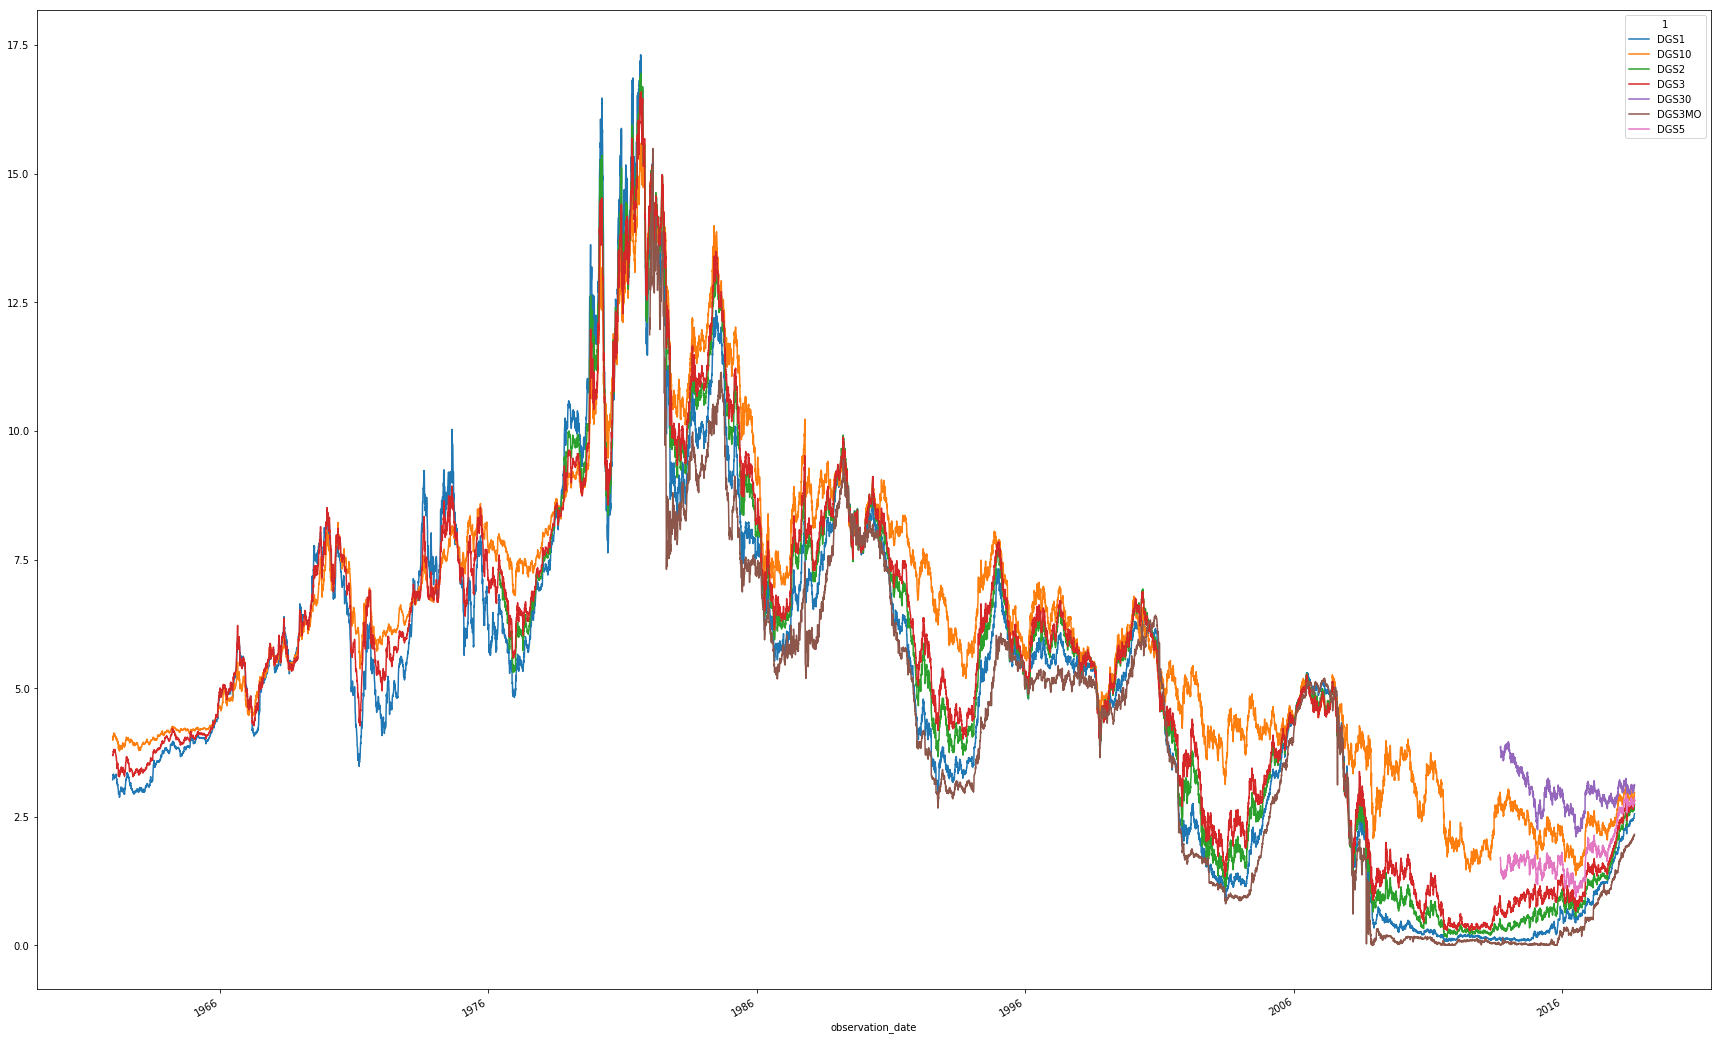
Using plotly for python, use mouse pointer to see the exact tooltip values Enjoy the zoom by drawing a square to part of the graph to look closely.
Future version will have a drop down filters
import plotly
from plotly.offline import download_plotlyjs, init_notebook_mode, plot, iplot
import cufflinks as cf
init_notebook_mode(connected=True)
cf.go_offline()

#plotly.tools.set_credentials_file(username='charchil1010', api_key='h6iK0B8bluU0nNJ1oZti')

y_col =  [i for i in result.columns if i != 'observation_date']

result.iplot(kind='scatter',x='observation_date',y= y_col, size=25)
Using matplotlib plot()
result.plot(x ='observation_date', y = y_col, figsize= (30,20))
<matplotlib.axes._subplots.AxesSubplot at 0x2188f0d9630>

Read, Clean, Create Schema and Load bunch of csv files to MySQL with Python
Implement Machine learning models to predict interest rates of Bonds from scratch